

A torque tool engages. Torque rises, angle is captured, the tool shuts off. In automotive assembly, this sequence repeats thousands of times per shift - and every single fastening leaves behind a data point. The critical question isn't whether that data exists, but whether it's being analyzed in real time before process drift becomes the root cause of scrap.
That's exactly where real-time SPC (Statistical Process Control) comes in. This guide walks through how to build the data pipeline from tool to control chart, which metrics actually matter, and what a live dashboard with meaningful early warnings looks like - using GWK tools QUANTEC MCS®, OPERATOR®, and Q-CHECK® as data sources.
What Sets Real-Time SPC Apart from Traditional Quality Inspection
SPC is a statistical process control method used to monitor ongoing processes based on measured values and evaluate them for deviations - with the goal of making variation visible and securing product quality while production is still running.
The difference from end-of-line inspection: decisions are based on actual measurement results rather than assumptions, and corrective actions are taken where the real causes lie - not after the fact at the end of the line.
A process capability study (PCS) is always a snapshot in time. Tool wear, material variation, or new operators can degrade process capability over time. Continuous monitoring through SPC is therefore essential.
The takeaway: the PCS per VDI/VDE 2645-3 provides the starting point - SPC secures ongoing operations. Both methods work hand in hand. For more on conducting a process capability study, see our practical article on PCS per VDI/VDE 2645-3.
Step 1: Data Sources and Data Flow
OPERATOR® - Production Data Straight from the Line
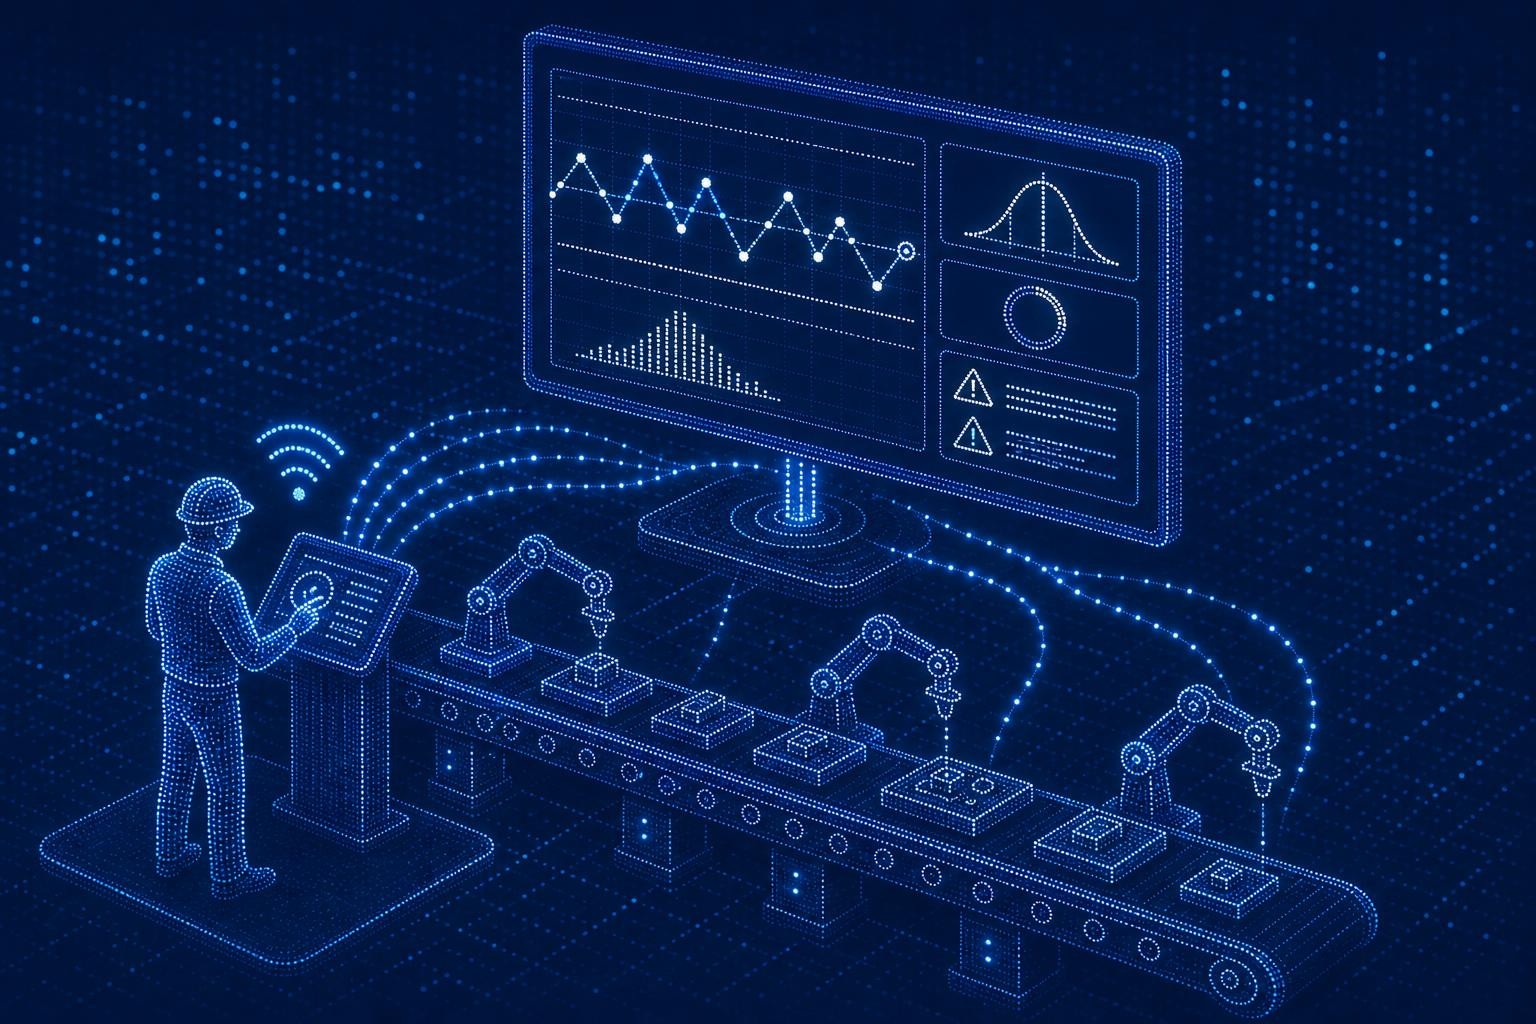
The OPERATOR® captures the shutoff torque, rotation angle, and fastening result (OK/NOK) for every fastening cycle and transmits these values via WLAN to upstream systems. The OPERATOR® EST01 additionally communicates via PLC and Open Protocol - enabling direct integration with MES or SCADA systems without any media breaks.
Raw data relevant to SPC analysis per fastening cycle:
- Shutoff torque (Nm) - primary control variable
- Rotation angle (°) - supplementary variable, especially relevant for angle-controlled processes
- Fastening result (OK/NOK) - basis for scrap rate calculations
- Timestamp and tool ID - for trend analysis and tool-to-tool comparison
QUANTEC MCS® - Analysis and Development
The QUANTEC MCS® analysis tool with fixed-point-free angle measurement delivers high-resolution torque curves. In quality assurance and development, it is used to characterize fastening joints in detail - data flows into the analysis environment via QuanLab Pro®. For establishing the SPC baseline (e.g., the scatter characteristics of a new fastening application), the QUANTEC MCS® is the tool of choice.
Q-CHECK® - Audit and Residual Torque Measurement
The Q-CHECK® QS and audit tool, with an accuracy of ±1% between 10 and 100% of the nominal range and a measurement range of 3-1000 Nm, delivers the residual torque measurements required by VDI/VDE 2645-3 for the process capability study. With 2 GB of internal storage, measurement data can be captured without a live network connection and imported into the SPC environment later.
 AI-generated image
Step 2: The Right Metrics - Cmk, Cpk, and What They Actually Mean
Cmk - Machine Capability as the Starting Point
The machine capability index Cmk measures the short-term capability of a machine to produce parts within specified tolerances. It is determined under controlled conditions and reflects the pure machine influence - excluding variation from personnel, material, or environment.
Practical benchmarks:
| Cmk-Wert | Bewertung | Empfohlene Maßnahme |
|---|---|---|
| ≥ 1,67 | Hochfähig | Regelbetrieb, SPC-Überwachung |
| 1,33 – 1,67 | Fähig, Verbesserungspotenzial | Engmaschigere Überwachung, Ursachenanalyse |
| < 1,33 | Nicht fähig | Sofortiger Eingriff, Prozessoptimierung |
In the automotive industry, many OEMs require a Cmk ≥ 1.67 for safety-critical processes. A Cmk of 1.67 means that 99.99994% of all fastenings fall within the allowable tolerances.
Cpk - Process Capability Under Production Conditions
Unlike a machine capability study (MCS), a process capability study accounts not only for machine influence but also for the additional input categories of personnel, material, method, and environment.
Control charts reveal whether a process is running in a stable state, while process capability indices show whether the required tolerances are being maintained consistently. The check is whether the natural variation of the process falls within the required limits. A process can run stably and still produce nonconforming parts if its location or spread doesn't align with the tolerances.
A Cpk of 1.67 yields a defect rate of just 0.57 ppm (parts per million). A Cpk of 1.33 already yields 63 ppm. For safety-critical fastening joints, this difference is not academic - it's decisive.
Cp vs. Cpk: Potential and Location
Cm and Cp describe "potential capability" - the capability that could be achieved if the process were perfectly centered. In the ideal case, when the process mean sits exactly at the center of the tolerance range, Cpk equals Cp; otherwise, Cpk is lower.
For SPC practice: Cp shows whether the process fundamentally fits within the tolerance. Cpk shows whether it actually does. Both values must be visible in the dashboard.
Step 3: Building Control Charts - Types, Limits, and Signals
Which Control Chart for Fastening Processes?
For fastening processes with continuous measured values (torque, angle), the following chart types are appropriate:
- x̄-R chart (mean-range chart): For subgroups with n = 2-10 measurements per time unit. The classic choice for series production.
- x̄-s chart (mean-standard deviation chart): For larger subgroups requiring more precise spread estimation.
- Individuals chart (I-MR): When each fastening is evaluated individually - typical for audit sampling with the Q-CHECK®.
Warning and Action Limits
Beyond the statistically derived definition of warning and action limits, it is important to consider how quickly and how strongly a process responds to an intervention. When a warning or action limit is exceeded, immediate steps must be taken to verify the inspection results and initiate Out-of-Control Action Plans (OCAPs) to restore process stability.
Typical limit values for fastening processes:
- Warning limits: ±2σ from the mean
- Action limits: ±3σ from the mean
Trend Rules and Outlier Detection per Western Electric
The classic Shewhart control chart only triggers an alarm when a data point falls outside ±3σ from the mean. The problem: small but systematic process drifts go undetected for a long time.
The Western Electric rules respond earlier by treating patterns within the 3σ limits as signals as well: Rule 1 - one point outside ±3σ (clear special cause); Rule 2 - two out of three consecutive points outside ±2σ on the same side; Rule 3 - four out of five consecutive points outside ±1σ on the same side; Rule 4 - eight or more consecutive points on the same side of the centerline.
Particularly relevant for fastening processes: Rule 4 detects gradual process shifts - such as those caused by tool wear or temperature effects - long before any individual value violates the action limit.
Practical Tip – Trend Monitoring: In your SPC software, enable at least Western Electric Rules 1 and 4. Rule 1 catches outliers; Rule 4 detects drifts. For safety-critical bolting applications (VDI/VDE 2862 Class A), Rule 2 is also recommended to identify early increases in variation.
Step 4: Live Dashboard - What Actually Belongs on the Screen
An SPC dashboard for fastening processes is not an end in itself. It must show the operator and the quality engineer at a glance whether action is needed. Less is more.
Required Elements of a Fastening Process Dashboard
| Element | Content | Update Frequency |
|---|---|---|
| Control chart (x̄-R) | Last 25-50 fastenings per fastening point | Real time, per fastening |
| Cpk display | Current value + trend (last shift Cpk) | Rolling, every 50 fastenings |
| OK/NOK rate | Share of nonconforming fastenings per shift | Cumulative, per shift |
| Alarm status | Active Western Electric rule violations | Immediately upon trigger |
| Tool status | Calibration due date, operating hours | Daily |
Configuring Early Warnings Correctly
Proactive countermeasures become possible through early detection of trends and deviations. An automated early warning system ensures continuous monitoring of a large number of process parameters.
Three escalation levels have proven effective in practice:
- Yellow - Warning: Cpk drops below 1.67, or Western Electric Rule 2/3 triggered -> notify operator and shift supervisor
- Orange - Action required: Cpk below 1.33, or Rule 1/4 triggered -> evaluate process stop, initiate root cause analysis
- Red - Process stop: Multiple consecutive NOK fastenings, or Cpk below 1.0 -> stop the line, notify quality engineer
Step 5: Connecting to the PCS per VDI/VDE 2645-3
The goal of a process capability study for fastening applications is to evaluate and document the quality capability of a fastening process under production conditions. The PCS provides the basis for assessing and continuously improving the fastening process.
This includes identifying systematic influences for targeted process improvement, evaluating the effectiveness of process improvement measures, and defining the action limits for quality control charts.
The PCS therefore delivers exactly the action limits that are entered into the control chart in Step 3. The loop closes:
Want to know whether your current bolting processes are SPC-capable? GWK analyzes your bolting application and shows you which metrics and tools make sense for your use case.
Request a free screw process analysisCommon Mistakes When Building Real-Time SPC
In practice, many SPC errors arise from intervening in a process that is actually stable. Adjusting after every outlier increases variation rather than reducing it - a classic overadjustment error.
Other typical pitfalls:
- Wrong chart type: Using an individuals chart for subgroup data, or vice versa - this significantly distorts warning and action limits.
- Insufficient baseline data: A reliable capability study requires at least n = 50, ideally n = 100 data points.
- No normality check: A Cpk of 1.50 for a normally distributed characteristic is not directly comparable to a Cpk of 1.50 for a Weibull-distributed characteristic, because the underlying defect rates differ. Fastening processes with one-sided tolerances (e.g., minimum torque) require particular attention.
- Dashboard without context: Cpk values without an accompanying control chart tell you very little. Always look at the visuals first (histogram, control chart) before looking at the numbers (Cpk). The visuals often tell the more important story.
Interactive Cpk Calculator for Fastening Processes
Calculate directly whether your fastening process meets the required capability indices:
Conclusion: SPC Is Not a Project - It's an Operating Mode
Real-time SPC for fastening processes only works when three conditions are met: precise measurement data from calibrated tools, correctly parameterized control charts based on a valid process capability study, and a dashboard with alarms configured to drive action - not paralysis.
QUANTEC MCS®, OPERATOR®, and Q-CHECK® provide the data foundation. The connection to the PCS per VDI/VDE 2645-3 ensures that action limits are not set arbitrarily but are grounded in measurement science. And the Western Electric rules ensure that drifts are detected long before an outlier stops the line.
This is not a theoretical concept. It is the state of the art in fastening assembly - and with the right tools, it is achievable today.
See live how QUANTEC MCS® and OPERATOR® deliver data for your SPC analysis — in a personalized demo with GWK application engineers.
Live demo: QUANTEC in actionWhat is the difference between Cmk and Cpk in bolting technology?
Cmk (machine capability index) evaluates the short-term capability of the bolting tool under controlled conditions — without the influence of operators, materials, or the environment. Cpk (process capability index) captures long-term capability under real production conditions and accounts for all influencing factors. For a complete assessment per VDI/VDE 2645-3, both metrics are required: Cmk as the tool's baseline, and Cpk as proof of process capability in operation.
How many data points do I need for a reliable SPC analysis?
For the initial process capability analysis (PCA) per VDI/VDE 2645-3, a minimum of 50 — ideally 100 — measurements is recommended. For ongoing SPC monitoring with control charts, a rolling 25–50 measurements per evaluation interval is sufficient, provided the baseline from the PCA is available.
Which GWK tool is suitable for residual torque measurement per VDI/VDE 2645-3?
The Q-CHECK® QS and audit tool is specifically designed for residual torque measurements for process capability analysis per VDI/VDE 2645-3. With an accuracy of ±1% between 10 and 100% of the nominal range and a measurement range of 3–1000 Nm, it covers the typical requirements in automotive and mechanical engineering.
What are the Western Electric Rules and why are they relevant for bolting processes?
The Western Electric Rules are four decision rules for control charts that detect systematic process changes before any individual value breaches a control limit. For bolting processes, Rule 4 is particularly important (eight consecutive points on one side of the centerline): it detects gradual drifts caused by tool wear or temperature effects at an early stage.
Can the OPERATOR® EST01 be integrated directly into SPC software?
Yes. The OPERATOR® EST01 communicates via PLC interface and Open Protocol, enabling direct integration with MES systems, SCADA layers, and SPC software. Every fastening transmits the shut-off torque, rotation angle, and OK/NOK result in real time — with no manual data entry required.