A fastening tool passes the machine capability study with a Cmk of 1.85 - and yet three weeks later the first customer complaints start coming in. That sounds paradoxical, but it is not. Anyone who confuses Cmk and Cpk, or calculates them incorrectly, risks invalid process approvals, costly rework and, in the worst case, recalls for safety-critical joints.
This technical article explains what Cmk and Cpk (often also written as CmK and CpK) actually mean, how to correctly calculate both capability indices step by step - with concrete numerical examples from torque analysis - and what the limit values imply for your day-to-day production practice.
Cmk vs. Cpk: Two metrics, two completely different statements
Both indices measure capability - but on different levels and under different conditions. This distinction is fundamental and is often underestimated in practice.
Cmk (machine capability index) is the result of the machine capability study (MFU). It evaluates the fastening tool only, under controlled laboratory conditions: same operator, same fastening position, same environment, no interruptions in the sequence. The question Cmk answers is: Can this tool, under ideal conditions, basically keep the required tolerance? In other words, Cmk reflects the intrinsic machine capability and repeatability of the tool.
Cpk (process capability index) is the result of the process capability study (PFU). It evaluates the complete fastening process under real series-production conditions - including operator influence, material variation, shift changes and environmental disturbances. The question here is: Does the overall fastening process reliably keep the tolerance in everyday production over time? This makes Cpk (CpK) the central process capability index for assembly quality assurance.
| Feature | Cmk - Machine Capability | Cpk - Process Capability |
|---|---|---|
| Study type | MFU (Machine Capability Study) | PFU (Process Capability Study) |
| Timeframe | Short-term study (one production run) | Long-term study (representative period) |
| Conditions | Controlled laboratory conditions | Real serial production |
| Influencing factors | Only machine influence | People, Material, Method, Machine, Environment |
| Sample size | ≥ 50 consecutive tightening operations | ≥ 125 measurements from the serial production |
| Standard basis | VDI/VDE 2645-2 | VDI/VDE 2645-3 |
| Minimum limit | Cmk ≥ 1.67 (Class A/B) | Cpk ≥ 1.67 (Automotive) |
| Statement | Can the tool consistently meet the tolerance? | Does the overall process consistently meet the tolerance over time? |
| When to perform? | Before production start, after tool change | Continuously in ongoing production |
A good Cmk is a necessary prerequisite for a good Cpk - but by no means a guarantee. In practice, Cpk almost always turns out lower than Cmk because additional disturbance factors are present in series production that do not occur under laboratory conditions.
The formulas: How to calculate Cmk and Cpk
The mathematical structure of both indices is identical - the difference lies in the input data and the conditions under which they are collected.
Calculating Cm and Cmk
The Cm value describes the potential machine capability assuming that the process mean is exactly centered in the tolerance:
Cm = (USL - LSL) / (6 × σ)
Here, USL is the upper specification limit (OSG), LSL is the lower specification limit (USG), and σ is the standard deviation of the measurement series. This Cm value is the basic capability index for the tool, but still ignores centering.
Since in practice the mean is rarely exactly at the center of the tolerance band, the Cmk value is the decisive metric. It takes into account the actual position of the mean relative to the tolerance limits:
Cmk = min [ (USL - x̄) / (3σ) ; (x̄ - LSL) / (3σ) ]
You always use the smaller of the two partial values - because the critical bottleneck is where the mean comes closest to the nearest tolerance limit. This is the standard CmK / machine capability formula.
Calculating Cpk (CpK formula)
Cpk uses the same formula as Cmk, but with measurement data from a long-term study:
Cpk = min [ (USL - x̄) / (3σ) ; (x̄ - LSL) / (3σ) ]
The key difference: the standard deviation σ is calculated from at least 125 measured values that have been collected over a representative production period with all real influence factors - not from an isolated short-term measurement. Only then does the CpK process capability index reflect actual series behavior and not just idealized conditions.
Step-by-step example: Cmk for a torque joint
Imagine a wheel nut joint under torque control. The design engineer has defined the following requirements:
- Target value: 120 Nm
- Upper tolerance limit (USL): 132 Nm
- Lower tolerance limit (LSL): 108 Nm
- Tolerance width: 24 Nm
In the MFU, 50 consecutive tightenings are measured on the torque tester under controlled conditions. Measurement data analysis yields:
- Mean x̄: 118.5 Nm
- Standard deviation σ: 1.8 Nm
Calculation:
- Cmk_upper = (132 - 118.5) / (3 × 1.8) = 13.5 / 5.4 = 2.50
- Cmk_lower = (118.5 - 108) / (3 × 1.8) = 10.5 / 5.4 = 1.94
- Cmk = min (2.50 ; 1.94) = 1.94
The tool passes the MFU with Cmk = 1.94 - it is capable from a machine capability perspective. However, the slight downward shift of the mean to 118.5 Nm is noticeable. If the scatter were only slightly higher, or the shift more pronounced, the Cmk could drop below 1.67. This information is highly valuable for fine-tuning the torque control parameters of the tool.
And what if the Cpk then turns out worse?
Now assume the PFU with 125 measurements in series production uses the same tolerance limits, but yields:
- Mean x̄: 119.2 Nm
- Standard deviation σ: 3.1 Nm (greater scatter due to series conditions)
- Cpk_upper = (132 - 119.2) / (3 × 3.1) = 12.8 / 9.3 = 1.38
- Cpk_lower = (119.2 - 108) / (3 × 3.1) = 11.2 / 9.3 = 1.20
- Cpk = min (1.38 ; 1.20) = 1.20
Although Cmk = 1.94 was perfectly fine, Cpk is only 1.20 - conditionally capable, so no process release possible for class A. The difference: in series production, shift changes, operator aids, material variation and operator behavior come into play and almost double the standard deviation. This is why a realistic process capability index must always be based on real production data from a torque tester or in-line angle sensor system.
Calculate your own values directly in the interactive capability index calculator:
What do the limit values actually mean?
The limit values 1.33 and 1.67 are not arbitrary numbers. They have a direct statistical meaning: a Cmk > 1.67 means that the fastening tool uses at most 60% of the tolerance specified by the design engineer - the rest is a statistical safety buffer.
Expressed in ppm values: a Cpk of 1.67 results in a scrap rate of 0.57 ppm, while a Cpk of 1.33 already yields 63 ppm. For an annual production of 500,000 screw joints, this means:
- Cpk = 1.67: ~0.3 defective joints per year
- Cpk = 1.33: ~32 defective joints per year
- Cpk = 1.00: ~1,350 defective joints per year
| Cmk / Cpk Value | Rating | Scrap (ppm) | Practical consequence | VDI 2862 Class |
|---|---|---|---|---|
| < 1,00 | ❌ Not capable | > 2.700 ppm | Immediate production stop. Tool not suitable. | No approval |
| 1,00 - 1,33 | ⚠️ Grenzwertig | 66 - 2.700 ppm | 100% inspection required. Readjustment needed. | Class C only (conditional) |
| 1,33 - 1,67 | 🟡 Conditionally capable | 0,57 - 63 ppm | Increased monitoring. Class C approved, B conditional. | Class C / B conditional |
| ≥ 1,67 | ✅ Capable | < 0,57 ppm | Process release possible. Class A/B requirements met. | Class A, B, C |
| ≥ 2,00 | ✅✅ Excellent | < 0,001 ppm | Six Sigma level. Aerospace & Medical Technology standard. | All classes (highest requirements) |
In medical technology or aerospace, higher values are often required than in general mechanical engineering. For aerospace applications with extreme safety requirements, Cmk/Cpk ≥ 2.00 is not uncommon.
Connection with screw joint classes according to VDI/VDE 2862
Capability indices are not an end in themselves - they are directly tied to the screw joint classification according to VDI/VDE 2862. The more safety-critical a joint is, the higher the requirements for Cmk and Cpk.
- Class A (safety-critical, e.g. brake system, steering, airbag igniter): Proof of MFU and PFU is mandatory. Industry practice is Cmk/Cpk ≥ 1.67, in some cases ≥ 2.00.
- Class B (function-critical, e.g. chassis and powertrain components): MFU is obligatory, PFU recommended. Cmk ≥ 1.67 is commonly used as a minimum requirement.
- Class C (not safety-relevant, e.g. trim parts): Basic tool control is sufficient. Cmk ≥ 1.33 as a minimum threshold.
You can find more on the requirements for each category in our article VDI/VDE 2862 made easy: What categories A, B and C mean for your fastening processes.
In short, the screw joint class directly determines which Cmk your tool must demonstrate - and thus which requirements apply to tool selection, calibration, process capability studies and ongoing process monitoring.
Typical mistakes when calculating Cmk and Cpk
Common mistake: equating Cmk with Cpk
A passing Cmk value (≥ 1,67) does not mean that your screwing process is capable in serial production. The Cmk describes only the tool behavior under laboratory conditions - without shop-floor influence, material variance, or environmental disturbances. Only the Cpk from the PFU demonstrates the actual process capability in day-to-day production.
From practical experience, these are the most common sources of error in capability index calculation:
1. Sample size too small
With 25 instead of 50 measurements for Cmk, the confidence interval becomes so wide that the value is barely statistically reliable. Typically, 50 to 100 consecutive parts without changeovers are used to ensure a sufficient database and robust repeatability.
2. Measurement equipment not calibrated
Unsuitable measurement instruments, unstable test conditions or errors in data acquisition distort the Cmk. An uncalibrated measurement system with its own inaccuracy of ±3% significantly distorts the measured standard deviation - and suggests a better capability index than actually exists. Reliable Q-Check calibration is essential for valid results.
3. Equating Cm with Cmk
The Cm value ignores the location of the mean relative to the center of the tolerance. Anyone who reports only Cm conceals a possible systematic offset in the fastening tool. In audit situations, this leads to serious discussions, because the true machine capability (CmK) is not being shown.
4. Tolerance widened after the fact
The tolerance of a screw joint is usually defined by the design engineer - not by the tool manufacturer. Anyone who widens the tolerance limits just to achieve a better Cmk manipulates the result and jeopardizes joint safety.
5. Process stability not verified
A Cpk calculation is only permissible if the process has previously been shown to be stable (statistically under control). A control chart (e.g. x̄-s chart) must be free of control limit violations over the entire investigation period. Without this proof, the Cpk value has no real meaning as a process capability index.
Improving a poor Cpk: five systematic levers
How to systematically improve a poor Cpk value:
- Reduce variation: Calibrate tools, check screw-case hardness, minimize operator influence
- Center the process: Verify the setpoint, correct the mean deviation from the tolerance midpoint
- Question the tolerance: Check with the designer whether the tolerance limits are defined to be appropriate for the process
- Increase sample size: More measurements provide statistically more robust conclusions
- Check measuring instruments: An inaccurate measuring tool distorts the standard deviation - ensure DAkkS calibration
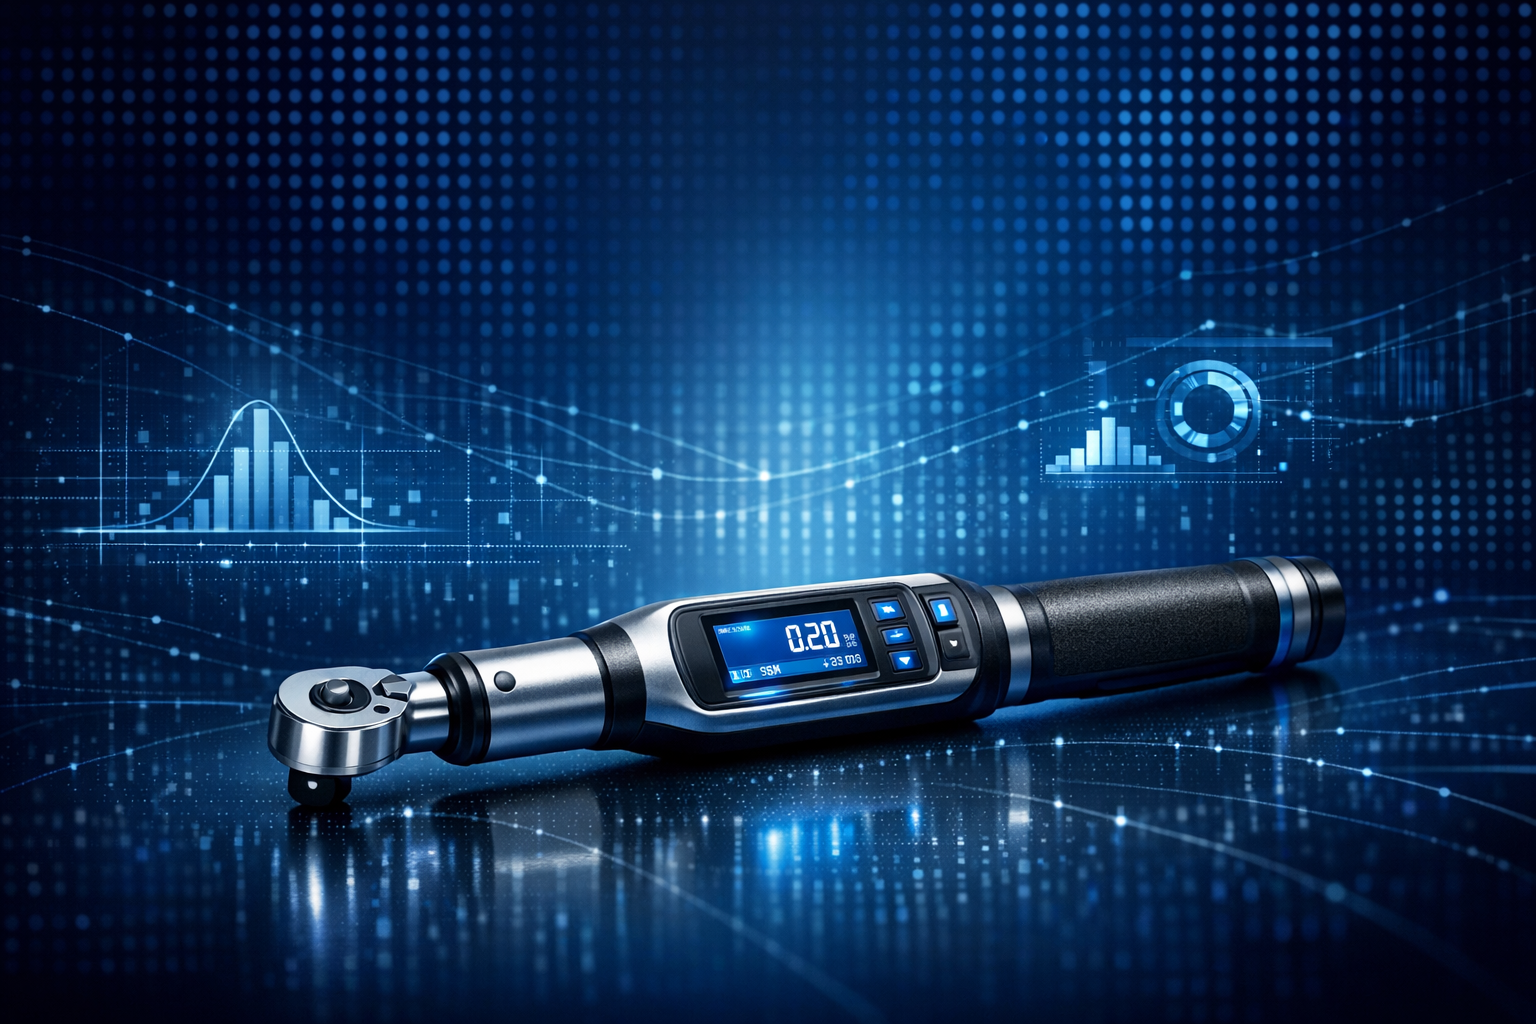
GWK QUANTEC MCS® and Q-CHECK®: The data foundation for robust capability calculations
A capability study is only as good as the measurement data on which it is based. Two factors determine the quality of the input data: the measurement accuracy of the test tool and the traceability of its calibration.
QUANTEC MCS®: Precise measurement data for MFU and PFU
The GWK QUANTEC MCS® analysis tool was developed specifically for test requirements according to VDI/VDE 2645. Its pivotless angle sensor technology with a robust aluminum-titanium design provides a measurement accuracy of ±1% between 10 and 100% of the nominal range - and it records torque and angle simultaneously in real time. This makes it ideal for high-end torque control and precision measurement technology.
For Cmk and Cpk calculation, one aspect is crucial: QUANTEC MCS® stores complete measurement curves in its integrated 2 GB memory. The raw measurement data is transmitted via WLAN directly to the QuanLabPro analysis software, which automatically calculates standard deviation, histograms, control charts and capability indices and documents them in compliance with the applicable standards. This end-to-end measurement data analysis significantly simplifies MFU and PFU in practice.
Another practical advantage: the residual torque measurement (Weiterdrehmomentmessung) of QUANTEC MCS® minimizes operator influence on the measured value - a critical factor for the reproducibility of PFU data and for reliable process capability studies.
You can find more on the use cases of process capability studies in our detailed guide to the process capability study (PFU) according to VDI/VDE 2645-3.
Q-CHECK®: Quality assurance tool for valid measurement results
Every capability study requires a calibrated measurement instrument with full traceability. The GWK Q-CHECK® quality assurance and audit tool operates with a measurement accuracy of ±1% of the nominal range and can be traced back to national standards via GWK's own DAkkS-accredited calibration laboratory (with reference standards of class 0.2). In other words, Q-Check calibration ensures that your measurement chain is robust and audit-proof.
In practice, this means: when your Q-CHECK® confirms the measurement accuracy of the fastening tool and QUANTEC MCS® records the fastening data, you obtain a complete, auditable measurement chain - from calibration of the test equipment through to the normative capability statement. This tightly closed chain is a decisive advantage for automotive OEMs and Tier-1 suppliers who must demonstrate full traceability of their measurement equipment at every audit.
Conclusion: Cmk and Cpk are not bureaucracy - they are your quality compass
The capability indices Cmk and Cpk provide the statistical basis for ensuring that screw joints deliver what the design engineer requires - reliably and reproducibly. Anyone who understands the formulas, can interpret the limit values and avoids common mistakes has a powerful instrument for assembly quality assurance.
The key takeaways at a glance:
- Cmk ≠ Cpk: Laboratory conditions (MFU) and series-production conditions (PFU) produce fundamentally different statements - both are required for a standard-compliant process release and a realistic view of process capability.
- Know the limits: Cmk/Cpk ≥ 1.67 is the industry standard for safety-critical joints; ≥ 1.33 is the absolute lower limit for conditional capability.
- Measurement data matters: Without calibrated, fully traceable test equipment and sufficient sample size, every capability statement is statistically worthless.
- Link to VDI 2862: The screw joint class determines which capability index must be demonstrated - and how closely you need to monitor your fastening processes.
If you have questions about implementing MFU or PFU in your own plant - or are looking for suitable test equipment for your capability studies - talk to us. Accuracy by GWK - together with you, we develop the optimal torque analysis and precision measurement technology solution for your specific requirements.
FAQ: Cmk and Cpk in screwdriving technology
What is the difference between Cm and Cmk?
The Cm-Wert (machining capability) considers only the scatter of the machine relative to the tolerance width, without considering the location of the mean. It assumes that the mean lies exactly in the middle of the tolerance. The Cmk-Wert additionally accounts for how far the actual mean deviates from the tolerance center. In practice, the Cmk is therefore always smaller than or equal to the Cm value — and is always the relevant key metric for process release.
How many measurements do I need for a valid Cmk/Cpk calculation?
For the MFU (Cmk) according to VDI/VDE 2645-2, at least 50 consecutive bolt connections under constant conditions are required. For the PFU (Cpk) according to VDI/VDE 2645-3, at least 125 measurements from a representative production run are needed. Too small samples lead to a large confidence interval and statistically unreliable statements.
Do I have to calculate Cmk and Cpk for torque AND angle?
It depends on the bolting strategy. In torque-controlled bolt tightening, the torque Cmk/Cpk is the focus. In angle-controlled procedures, the rotation angle is the control feature. In the commonly used combined torque-angle strategy, both quantities are evaluated separately. The GWK QUANTEC MCS® captures both parameters simultaneously and provides the data basis for both capability indices.
What does Cpk = 1.67 mean in ppm values?
A Cpk of 1.67 corresponds to, mathematically, a defect rate of 0.57 ppm (parts per million) - i.e., less than one defective part per two million bolted connections. For comparison: a Cpk of 1.33 already yields 63 ppm, i.e., around 100 times more potential defects. In automotive high-volume production with hundreds of thousands of connections per year, this difference is enormously relevant.
What Cmk limit does VDI 2862 require for Class A connections?
VDI/VDE 2862 prescribes, for Class A (safety-critical connections), essentially the demonstration of machine capability. Industry practice—especially in the automotive industry—considers Cmk ≥ 1.67 as the minimum requirement. For aerospace and medical technology applications, occasionally even stricter limits (up to Cmk ≥ 2.00) are agreed. The customer-side specification always ultimately decides.