
Anyone talking about AI in fastening technology today will quickly hear promises like "fully automated quality assurance" or "self-learning assembly lines." The reality is more sober - and more interesting. Machine learning can genuinely read things from torque-angle curves that conventional limit monitoring simply misses. But there are clear boundaries that anyone working seriously with this topic needs to understand.
This post is aimed at digitalization and quality assurance managers who want to know the state of the art - without the marketing spin.
The Torque Curve as a Fingerprint of the Joint
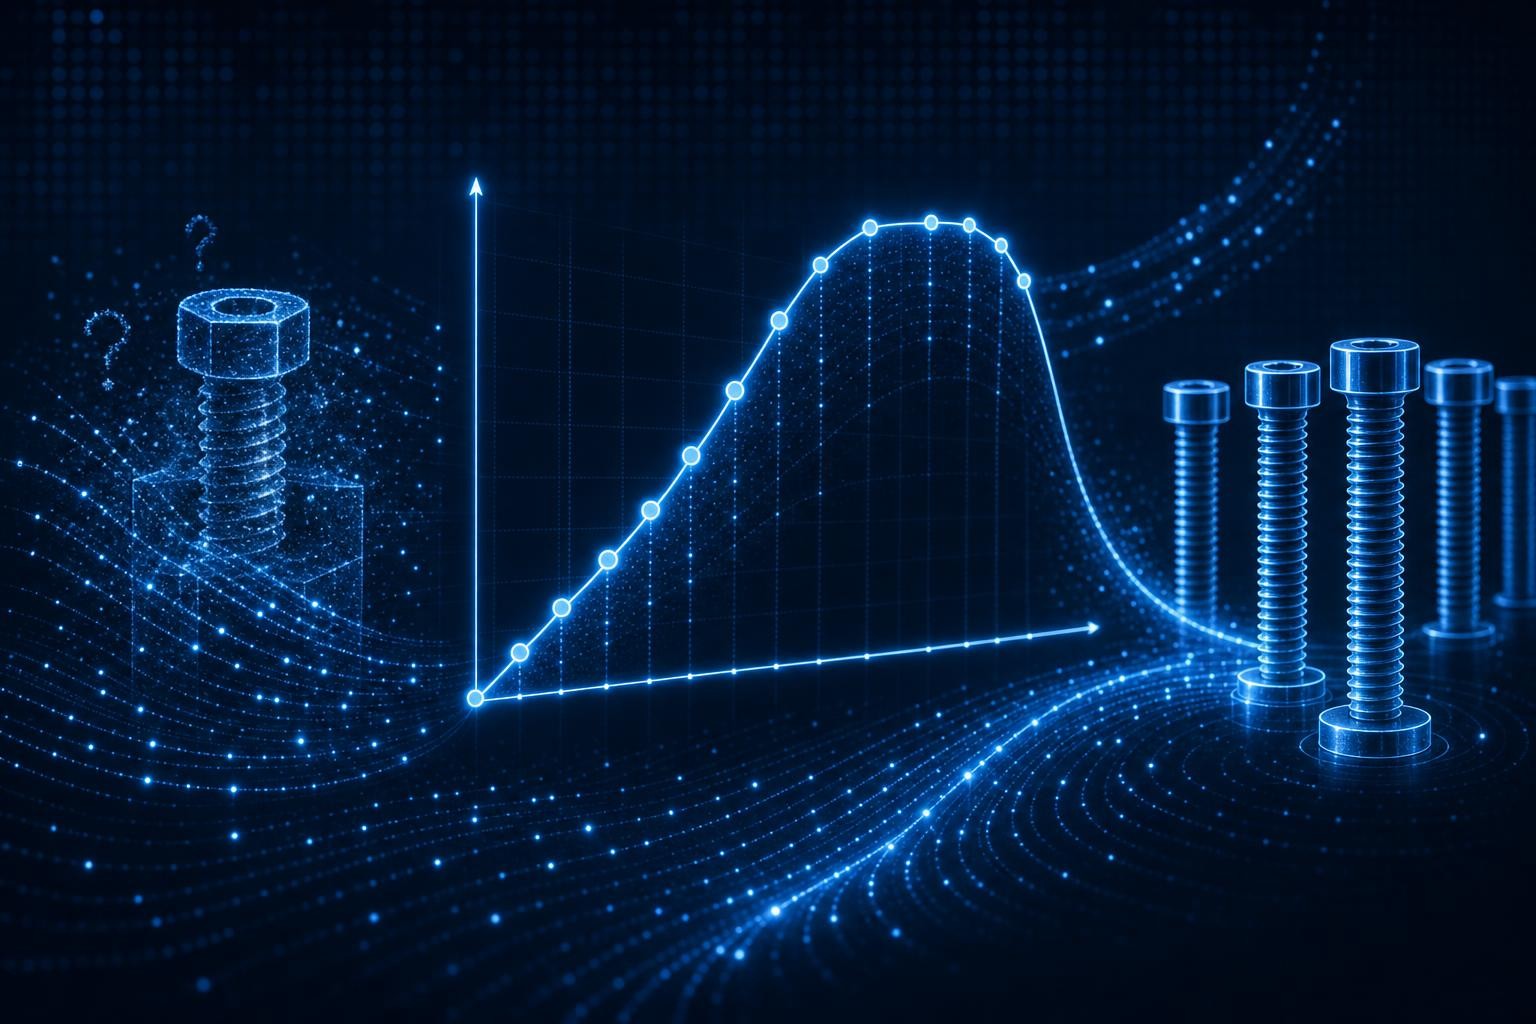
Every torque-angle curve is a reflection of the entire fastening process. It shows how torque and angle behave throughout the tightening sequence - from the run-in phase through the linear elastic region to the shutoff point. Component geometry, friction conditions, material stiffness, lubricant, presence or absence of a washer, thread integrity or damage: all of it leaves a characteristic signature in the curve.
The method provides a meaningful technique for assessing the current condition of a bolted joint. A typical tightening curve begins with a nonlinear run-in zone where components align, followed by the linear elastic region where clamp load builds. Deviations from this pattern - plateaus, kinks, missing slope phases - are not random. They are indicators of specific faults.
This is exactly where machine learning comes in: not as a replacement for the physical understanding of these curves, but as a tool that detects patterns across large curve datasets that the human eye would miss.
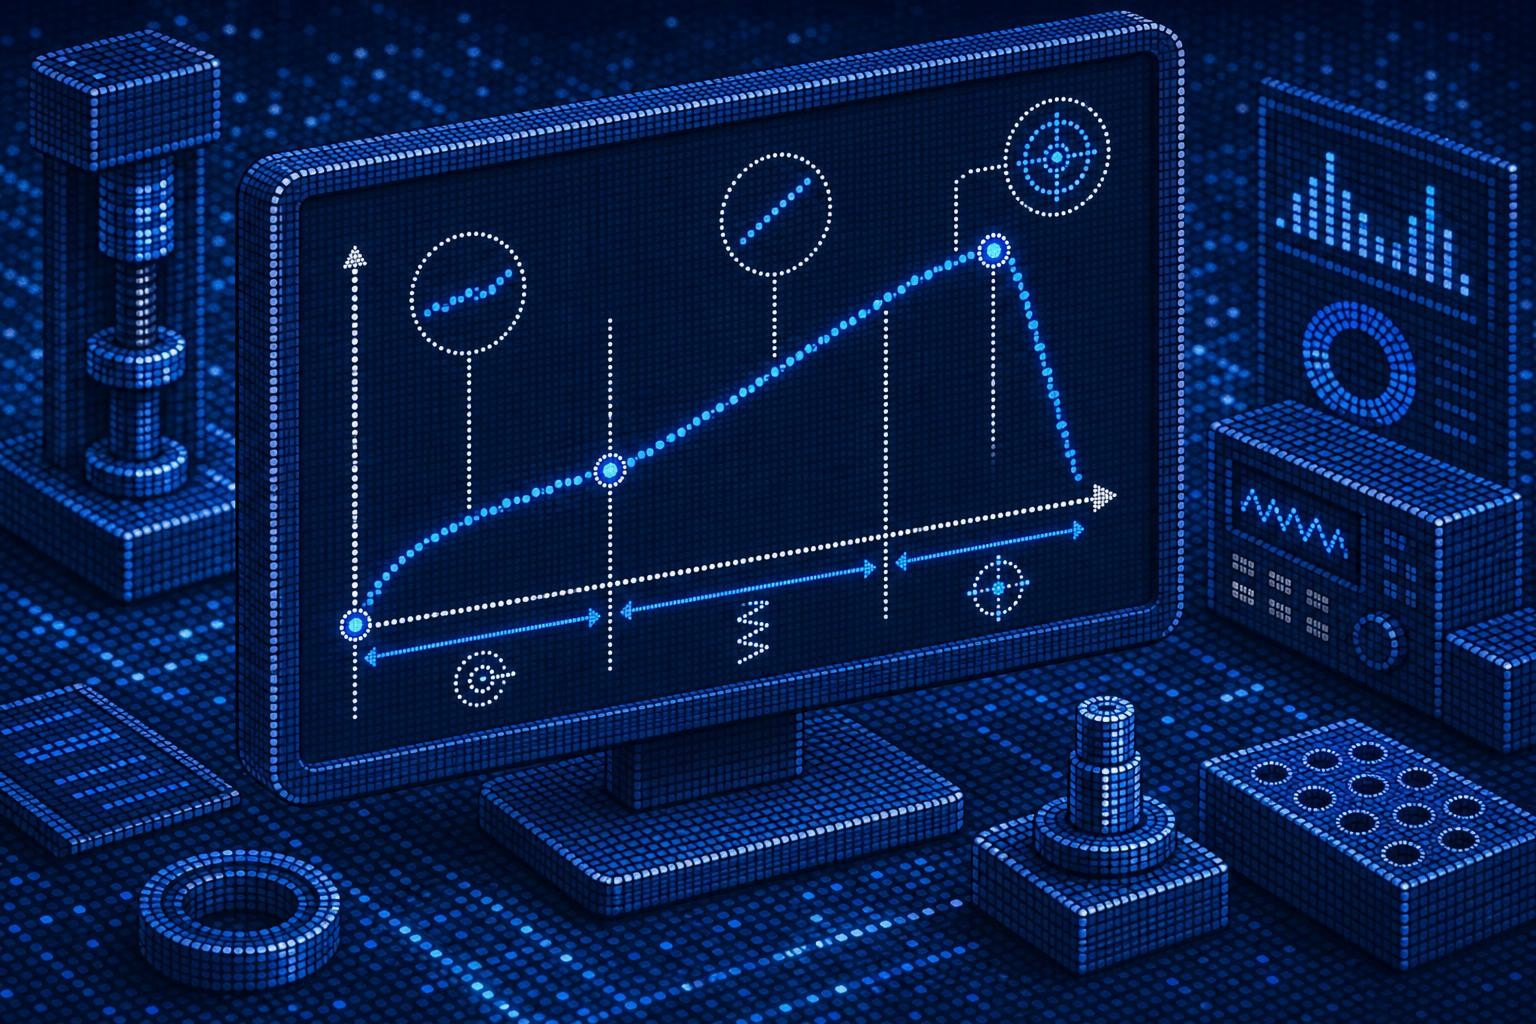 AI-generated image
What ML Can Actually Do
OK/NOK Classification Beyond Fixed Limits
Conventional limit monitoring asks: Is the final torque within the tolerance window? Is the rotation angle within the defined range? That is necessary - but not sufficient. A curve can satisfy both limits and still exhibit a fault signature - for example, when a settling effect mid-curve was compensated, or when the final torque lands inside the tolerance band by coincidence due to a cross-threading effect.
ML classifiers - trained on thousands of annotated curves - learn to evaluate the entire curve shape as a pattern, not just endpoint values. In a study using 2.8 million torque-angle data points from real industrial production, unsupervised methods such as Isolation Forest and Autoencoder achieved anomaly detection rates of up to 99% and 95-96%, respectively. These are not lab results - they come from live manufacturing data.
Detection of Specific Fault Patterns
Certain fault types leave characteristic signatures in the torque curve:
| Fault Type | Typical Curve Feature |
|---|---|
| Cross-threading | Irregular torque progression in the run-in phase, missing linear slope |
| Missing washer | Shortened run-in zone, earlier onset of slope |
| Settling | Plateau formation in the linear region, torque drop before recovery |
| Wrong component / wrong fastener | Deviating slope in the elastic region, altered final angle |
| Double tightening | Immediate steep torque rise with no run-in phase |
Applying machine learning to fault detection in automated fastening processes is complicated by the fact that fault signatures are often unknown in advance. Self-learning methods that first establish a baseline of normal fastening behavior can then flag deviations as anomalies.
Validation on live data from engine assembly shows a substantial improvement in fault detection compared to purely rule-based monitoring - particularly for fault types that do not produce a clear limit violation.
Pattern Recognition Across Large Curve Datasets
Another genuine benefit: ML can detect drift patterns that develop gradually across thousands of curves. Tool wear, changing friction conditions from lubricant changes, seasonal temperature fluctuations - all of these shift curve characteristics incrementally. Traditional quality inspection analyzes curves manually, which is time-consuming and error-prone. LSTM-based models can automatically analyze the quality of tightening curves, improving both the timeliness and accuracy of inspection.
The Limits - Stated Plainly
1. Data Quality and Labeling Are the Bottleneck
An ML model is only as good as the data it was trained on. In practice, projects rarely fail because of the algorithm - they fail because of the data foundation.
In concrete terms: curves must be traceably calibrated. A measurement without a calibration record is not a measurement - it is a number. Curves must be correctly annotated: Which curve shows cross-threading? Which is genuinely OK? Who decided that, and by what criterion? And curves must be consistently captured - same sampling rate, same tool configuration, traceable metadata.
The goal of a fastening analysis is to define robust and reproducible parameters - because theoretical assumptions from the design phase frequently diverge from actual conditions on the production floor. It is precisely this gap between assumption and reality that makes clean labeling so demanding.
2. The Black-Box Problem
Neural networks and ensemble methods deliver classification results, but no physical explanation. In quality assurance, this is a serious issue: for AI systems to earn the trust they need, human-understandable explanations of their predictions and decisions are essential - because only when processes are transparent will they be trusted.
For safety-critical fastening applications in Class A per VDI/VDE 2862 - joints where failure puts lives at risk - "the model says NOK" is not an adequate justification. A lack of transparency and explainability can cause serious faults to go undetected, or render the model unusable.
Explainable AI (XAI) methods such as SHAP values or surrogate models help, but are not a complete substitute for physical process understanding. Techniques like LIME create interpretable models for individual predictions; SHAP values and saliency maps provide intuitive explanations for AI decisions. That is progress - but not a blank check.
3. Rare Fault Classes
Cross-threading, double tightening, wrong components: these faults are rare in a well-run production environment. That is good for quality - and bad for the ML model. A classifier trained on 10,000 OK curves and 12 NOK curves will, in most cases, simply learn: "Everything is OK." The lack of balanced datasets due to insufficient data on faulty joints poses a significant challenge for developing robust detection models.
Techniques such as synthetic data generation, oversampling, or one-class classification can help - but they require expertise and add complexity to the project.
4. Limited Transferability Between Fastening Applications
A model trained on M8 fasteners in an aluminum housing does not automatically work for M10 fasteners in a steel assembly. Every fastening application has its own curve characteristics. The difficulty in identifying and monitoring bolted joints stems from the variability and nonlinear effects inherent in fastening connections.
This means: each relevant fastening application requires its own dataset, its own model, and its own validation. This is not a flaw in the approach - it is the physical reality of fastening technology.
5. No Substitute for Physics and Standards
ML recognizes patterns. It does not understand physics. It does not know standards. A model trained on historical data cannot assess whether a tightening method is even appropriate for a new fastening application. VDI 2862 defines the minimum technical requirements for fastening technology based on the risk associated with each joint and the assembly process. These normative requirements cannot be replaced by pattern recognition.
Key takeaway: Data quality beats algorithm. A simple model trained on clean, traceable, well-annotated data outperforms any complex neural network trained on poor data. Anyone looking to apply ML in fastening technology must first invest in the data foundation — not the algorithm.
Prerequisites for a Meaningful ML Deployment
Before launching an ML project, the following foundations must be in place:
- Traceable measurement technology: Curve data from uncalibrated tools is unsuitable for ML training. Measurement uncertainty must be known and documented.
- Consistent data capture: Same sampling rate, same tool configuration, complete metadata (fastening application ID, part number, timestamp, tool ID).
- Structured labeling: Fault types must be annotated by qualified personnel - ideally with reference to the physical finding (e.g., visual inspection after disassembly).
- Sufficient data volume: For supervised learning, at least several hundred annotated examples per fault class are required.
- Fastening application stability: The model applies to a defined fastening application - changes to the component, fastener, or process require retraining.
The Data Foundation: Where OPERATOR® and QUANTEC MCS® Come In
Precise, traceable curve data is the prerequisite for any meaningful ML deployment - and this is exactly where the difference between usable and unusable training data lies.
The OPERATOR® transmits curve data via WLAN directly to the analysis platform. The interchangeable square drive system allows the same tool body to be used across different fastening applications without interrupting the measurement chain. The OPERATOR® EST01 communicates via PLC and Open Protocol - curves are stored in the database in a structured format with complete metadata, not as isolated CSV files.
The QUANTEC MCS® analysis tool with reference-point-free angle measurement delivers curve data with ±1% accuracy between 10 and 100% of the nominal range - a level of precision that is critical for ML training. Training on noisy or systematically shifted curves produces a model that learns measurement errors, not fault patterns. Open interfaces to analysis platforms such as QuanLab Pro®, Ceus, and QS-Torque enable direct downstream processing of raw data without any media breaks.
Conclusion: Deploy Realistically, Don't Overestimate
Machine learning is not a cure-all for quality assurance in fastening technology - but it is a serious tool when the right conditions are in place. The most practical applications today are:
- OK/NOK classification based on the full curve shape, not just endpoint values
- Fault pattern detection for known fault types with sufficient training data
- Process drift detection across large curve datasets
What ML cannot do: explain physical relationships, replace normative requirements, work reliably with limited data, or transfer models between different fastening applications.
The decisive success factor is not the algorithm. It is the quality of the data the algorithm is trained on. Understanding this leads to asking the right questions - and investing first in measurement technology, not in the AI platform.
Accuracy by GWK.
How many curves does it take before an ML model makes sense for fastening processes?
There's no one-size-fits-all number, but as a general guideline: for supervised learning (OK/NOK classification), you need at least several hundred annotated examples per error class. For unsupervised anomaly detection (autoencoders, Isolation Forest), clean OK curves are sufficient — a few thousand is a reasonable starting point. What matters is not just quantity, but the quality and consistency of the data.
Can an ML model trained on one fastening case be transferred to another?
Generally no — at least not without adaptation. Every fastening case has its own curve characteristics, which depend on part geometry, material, fastener, lubricant, and tightening method. Transfer learning approaches can help reduce the effort for new fastening cases, but they still require validation data from the target fastening case.
How do I handle the black-box problem in safety-critical fastening cases?
For Class A fastening cases per VDI/VDE 2862, ML should be used exclusively as a support tool, not as the sole decision-making authority. Explainable AI (XAI) methods such as SHAP values can provide insight into the relevant curve features. Final sign-off must be performed by qualified personnel based on physically traceable criteria.
What data do I need to provide for an ML project?
At a minimum: traceably calibrated curve data (torque over angle, full curve), metadata per curve (fastening case ID, tool ID, timestamp, part number), and annotations (OK/NOK, error type). Ideally, also include documentation of the calibration history for the tools used.
Does ML replace the process capability study (PCS)?
No. The process capability study per VDI/VDE 2645-3 is a normative requirement fulfilled through statistical methods and calibrated reference tools. ML can be used as a complement to detect process drift at an early stage — but it replaces neither the PCS nor the regular calibration of production tools.